As France emerges from a historic heatwave, the Ministry of Ecological Transition has just presented the conclusions of the Water Assizes: reduce water withdrawals by 25% over fifteen years, facilitate the authorization of new uses for unconventional water[1], preserve aquatic ecosystems, and increase funding dedicated to water management. An event that has become increasingly regular over the years, this heatwave disrupts our habits and impacts our water consumption. Certainly, resources remain sufficient to meet the needs of the population, but more frequent drought episodes could lead to shortages on a more or less large scale. But what is the reality? This first article reviews water consumption at the household level.
Water in a few figures: withdrawals, consumption, and costs in France and around the world
Water withdrawals and consumption vary by country. These differences can be explained by the economic development level of each country, the resource itself, population density and its distribution, as well as the primary uses of water (The Water Information Center, n.d.). What quantities are withdrawn and consumed? Who are the biggest water users? What are the main uses of water worldwide, in France, and at the household level? Is the price of water in France high? What portion does water consumption represent in the budget of a French household?
The volumes of water extracted worldwide and in France and the various uses
Globally, in 2012, 3 890 billion cubic meters of freshwater have been extracted (i.e., taken from the natural environment and then returned, thus becoming available again). In Europe, these extractions amount to 218 billion cubic meters each year (eaufrance, 2019; The Water Information Center, n.d.). This water is intended for three main types of use, namely:
- Domestic uses (households and tertiary activities mainly) account for 10%;
- Industrial uses for 20% (e.g., manufacturing and extractive industries, energy producers);
- Agricultural uses (farming and livestock) account for 70%.
In 2016, in France, nearly 37 billion m3 of freshwater were extracted. Among them, the following five categories represent 99% of the extractions (eaufrance, 2019):
- Energy production, and more specifically for cooling power plants (56.2%);
- Drinking water supply (14.6%);
- Canal feeding (12.7%);
- Irrigation (8.6%);
- Industry (6.8%).
The average daily water withdrawals in France per capita, for domestic uses, are slightly below the European average. For example, as represented in Figure 1, they are about 2 times lower than those of Norway, but remain 1,37 times higher than those of Germany. In comparison to other territories, French withdrawals are just over 2 times less than those in the United States but remain almost 2 times higher than those in India (BIPE, 2015; eaufrance, 2019; The Water Information Center, n.d.).
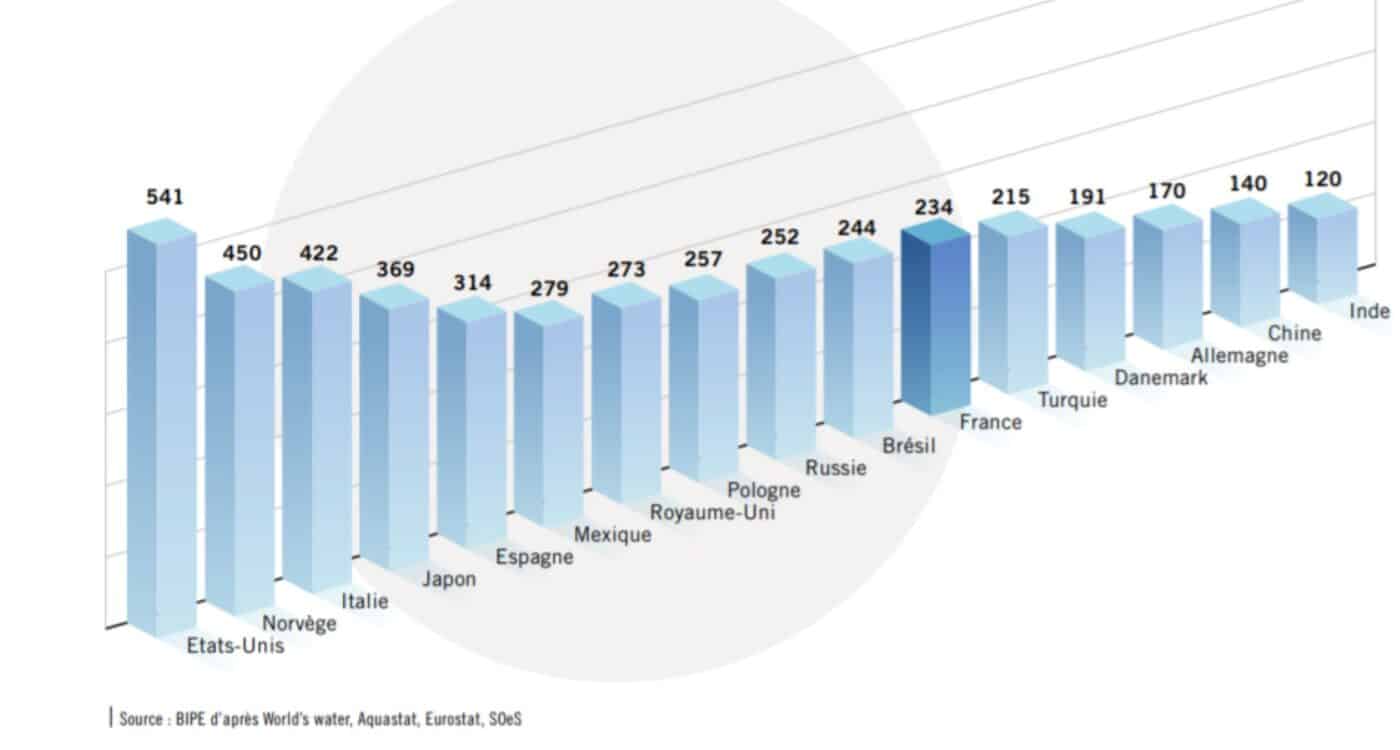
Extraction does not rhyme with consumption. Indeed, the volumes extracted are greater than the volumes actually consumed. These consumed volumes are taken from the natural environment before being used, and they will not be returned to their environment. In France, 234 liters of water are extracted per person per day, while the daily drinking water consumption of a French person has been estimated at 148 liters. Thus, there is a 30% differential between the extracted volume and the consumed volume. This difference is partly due to the aging of drinking water distribution networks (leaks, lack of maintenance, evaporation).
What about water consumption at the scale of a French household? What are its uses?
According to the Water Information Center, in France, the drinking water consumption of a household (2,5 people) amounts to an average of 120 m3 per year. Figure 2 represents the distribution of household water consumption according to different uses. This distribution can vary depending on the equipment used, how it is set, and the consumption habits of each user. Leaks can also greatly influence the amount of water used by a household, potentially accounting for 15 to 20% of the water consumed by the household (The Water Information Center, n.d.).

Drinking water expenses: What budget do these consumed volumes correspond to?
In France, in 2015, the average price of water and sanitation services was 3,52€ per m3 including tax and was 13% lower than the European average, which was 4,05€ per m3 including tax. The price in Denmark, which was the highest, was then 6,67€ per m3 including tax, while the lowest, in Italy, was 1,35€ (BIPE, 2015). Several factors can explain these differences, including: the management mode (public, private, or mixed), how management and distribution costs are charged to the population (e.g., fees or taxes), or the availability of the resource in the territory (quality and quantity) (Fp2e Aquae, 2011).

In 2013, a household spent an average of 151€ on consuming drinking water. Combined with sanitation, for which the average annual expenditure was 176€ in 2013, this expense item has represented 2000% of the household budget since the 0,8s (Figure 3), totaling 317€. The figure below compares this share to other household expenditure items. It is 2,6 times less significant than the share of the budget allocated to telecommunications and 5,5 times lower than that dedicated to electricity, gas, and fuel by the household (BIPE, 2015).
Although water consumption is not a major expense item in household budgets, 88% of French people say they are attentive to their water consumption (The Water Information Center, 2018). But what are the right actions to adopt to reduce water consumption?
12 actions to optimize your water consumption
In response to Figure 2, simple actions can reduce your household water consumption. They are presented in the illustration below.
Grouped by themes (general, home, outdoors), these actions are presented by usage. Each usage gathers information on consumption, possible actions to reduce this consumption, and the impacts of this action on your water consumption.
The eco mode of washing machines: a longer cycle but consuming less, is that possible?
On se concentre ici sur la consommation en électricité. En effet, 80% de l’énergie consommée lors d’un cycle de lavage sert à chauffer l’eau. Les cycles éco fonctionnent avec une eau à une température maximale de 50 °C (contre min. 60°C en mode « normal ») et avec une vitesse de chauffage de l’eau plus faible. Bien que le cycle soit plus long, le total de l’énergie consommée au cours d’un cycle éco reste inférieur de 30% par rapport à un cycle normal.
To go further in this approach, other daily habits can help reduce water consumption. Using water bottles instead of plastic bottles or installing dry toilets are two examples. Your lifestyle influences your water consumption and, on a larger scale, the environment: we talk about virtual water. Indeed, your choices in energy, food, clothing, etc., have quantifiable impacts on water resources globally. But how can we measure and evaluate this impact?

Water footprint, virtual water: the water needed for the production of a consumer good
The tomato you have on your plate seems small. Yet, at least 13 liters of water were needed for its production. Being aware of virtual water means being aware of the impact of our daily consumption on the entire production chain. Like the carbon footprint, which is now much more popular and almost systematically assessed by our industries, the "water footprint" is more timidly making its way into discussions.
Virtual water, or the association of international trade and water stress concepts.
Virtual water is defined as "the total water consumption necessary for a production, whether agricultural or industrial, or for a service" (The Water Information Center).< It is estimated that one-fifth of the water consumed worldwide is virtual.
Virtual water: a concept to analyze water potential at the country level
The concept of virtual water emerged in the early 1990s, initiated by Professor John Anthony Allan from King's College London, who was interested in the close relationship between water scarcity and international trade. The idea is simple: a country facing water stress might decide to import goods that require a large amount of water for their production to avoid worsening the scarcity and thus prevent a water war in the region. The need for water is thus displaced and exchanged between states. As a result, major exporting countries of agricultural products (Canada, the United States, Australia, Brazil, and France) become exporters of virtual water. Conversely, the main importers of virtual water are countries in the Near and Middle East as well as China, which is deficient in agricultural products.
The emergence of an indicator
The concept of water footprint emerged in the 2000s. The idea was to create an indicator recognized by UNESCO that would allow for global comparisons. It is the Water Footprint Network, a Dutch non-profit organization dedicated to raising awareness among citizens and administrators about freshwater consumption issues, that developed it. The overall water footprint of a state is equal to the volume of freshwater necessary for the production of goods or services consumed by its residents. An individual or a country that consumes more virtual water than it has must therefore import it to meet its needs. It is possible to assess the water footprint of a person, a country, or a product.
Globally, the Water Footprint Network estimates that on average, a human uses 1243 m3 of water per year, with international fluctuations ranging from 2483 m3 per person per year in the United States to 702 m3 in China.
A country's water footprint is determined by three different factors:
- The overall volume of consumption< is directly related to a country's wealth: this partly explains why countries like the United States, Spain, or Switzerland rank at the top;
- The lifestyle of the inhabitants: a diet rich in meat or a high consumption of industrial goods significantly increases a country's footprint;
- The climate: in hot countries, evaporation and thus water consumption for agriculture is particularly high.
This is why Sudan (with 2 214 m³/person/year), Senegal, or Syria have high water footprints. Additionally, most of these countries with unfavorable climatic conditions have agricultural practices that are particularly water-intensive.
For products, here are some references in terms of liters of water needed for the production of one kilogram of product (source: Water Footprints of Nations, 2007):
| Product | Global average (L/kg) |
| Coffee | 20 682 |
| Beef | 15 497 |
| Cotton | 8 242 |
| Rice | 2 975 |
| Milk | 990 |
The calculation method
The calculation of a country's water footprint includes two parts:
- The internal footprint, meaning the sum of water consumption from agricultural sectors (including rainwater and irrigation), industrial, and domestic, minus the exports of virtual water to other countries.
- The external footprint, that is to say, the difference between the volume of virtual water imported and the volume of virtual water exported.
Virtual water flows between countries are estimated by multiplying trade flows in goods by their virtual water volume.
While the concept remains highly relevant and the Water Footprint Network seeks to advance its calculation methods, the chosen approach is often contested by the international scientific community.
The limits of the concept
Essentially a quantitative indicator, it is criticized for not taking into account the differences in wealth among countries, water stress, and the type of water used for product production.
For example, to produce a glass of wine, the Water Footprint Network estimates that it takes 140 liters of water. This measure, which can be improved, does not take into account the differences in irrigation needs between wine-growing regions. To address this, individual initiatives are emerging. For instance, the Italian group Mutti, a sauce producer, wanted to partner with WWF to assess its total water footprint, including the amount of water needed for cultivation or for packaging production. Could this initiative be generalized to all sectors of activity?
Vertigo Lab has been working for several years on the development of an economic-environmental accounting system and on the creation of economic models based on this accounting system. This is the case, for example, with the ImpacTer model. It allows for the evaluation of socioeconomic impacts (revenue, added value, jobs created, household income) and environmental impacts (e.g., GHG emissions, waste generation, water extraction) in order to identify action pathways to optimize socioeconomic returns while integrating environmental constraints. The interest of this model is not to focus solely on direct impacts but also to integrate the spillover effects that an activity can have on all activities positioned in its value chain (indirect impacts).
If the model has not yet been utilized for the water sector, it could allow for the assessment, at the scale of a watershed for example, of the socio-economic and hydrological impacts of water policies implemented in the area. The model could also help determine the degrees of dependence of a regional economy on the availability and quality of the local water resource. These tools would facilitate the management of this resource in decision-making for local public water policies.
References
- [1] Treated wastewater, rainwater, drainage water, gray water, etc.
Biography
- Water Footprint Network (Water Resource Manage 2007) https://waterfootprint.org/en/
- Virtual water and water footprint: what is it? https://www.cieau.com/le-metier-de-leau/ressource-en-eau-eau-potable-eaux-usees/eau-virtuelle-empreinte-eau-quest-ce-que-cest/<
- The water footprint, the new indicator for measuring freshwater waste https://reporterre.net/L-empreinte-eau-le-nouvel<
- Water footprint http://www.empreinteh2o.com
- Y. Hoekstra·A. K. Chapagain, Water footprints of nations: Water use by people as a function of their consumption pattern(2007)
- BIPE, 2015. Public water and sanitation services in France – Economic, social, and environmental data.
- eaufrance, 2019. BULLETIN N°5: QUANTITATIVE WITHDRAWALS FROM WATER RESOURCES.
- Fp2e Aquae, 2011. Water prices per m3 in Europe.
- The Water Information Center, 2018. FRENCH PEOPLE AND WATER – National survey 2018.
- The Water Information Center, n.d. How is water extracted and used around the world? https://www.cieau.com/le-metier-de-leau/ressource-en-eau-eau-potable-eaux-usees/comment-leau-est-elle-prelevee-et-utilisee-dans-le-monde
- The Water Information Center, n.d. What is the average water consumption per household? https://www.cieau.com/le-metier-de-leau/ressource-en-eau-eau-potable-eaux-usees/quels-sont-les-usages-domestiques-de-leau/<
- 7 tips to reduce your water consumption https://www.dossierfamilial.com/vie-pratique/economies/7-tips-to-reduce-your-water-consumption-342685<
- Survey. How do you consume water? https://www.irstea.fr/fr/toutes-les-actualites/eaux/enquete-comment-consommez-vous-leau
- Water consumption: tips for saving – How to reduce your water consumption through simple actions? https://www.lenergietoutcompris.fr/actualites-et-informations/economies-energie/consommation-d-eau-les-astuces-pour-faire-des-economies-47654
- Technical note – Measurements of electricity consumption of different dishwasher cycles http://blog.amoes.com/public/2015/NT15-05_Interets_cycles_ECO_LV.pdf
- Eco-citizen actions to preserve water http://www.eau-artois-picardie.fr/education-leau-dossiers-thematiques/gestes-eco-citoyens